
Example Docker Compose project for Telegraf, InfluxDB and Grafana
This an example project to show the TIG (Telegraf, InfluxDB and Grafana) stack.
Start the stack with docker compose
$ docker-compose up
Services and Ports
Grafana
URL: http://localhost:3000 User: admin Password: adminTelegraf
Port: 8125 UDP (StatsD input)InfluxDB
Port: 8086 (HTTP API) User: admin Password: admin Database: influxRun the influx client:
$ docker-compose exec influxdb influx -execute 'SHOW DATABASES'
Run the influx interactive console:
$ docker-compose exec influxdb influx Connected to http://localhost:8086 version 1.8.0 InfluxDB shell version: 1.8.0 >
Import data from a file with -import
$ docker-compose exec -w /imports influxdb influx -import -path=data.txt -precision=s
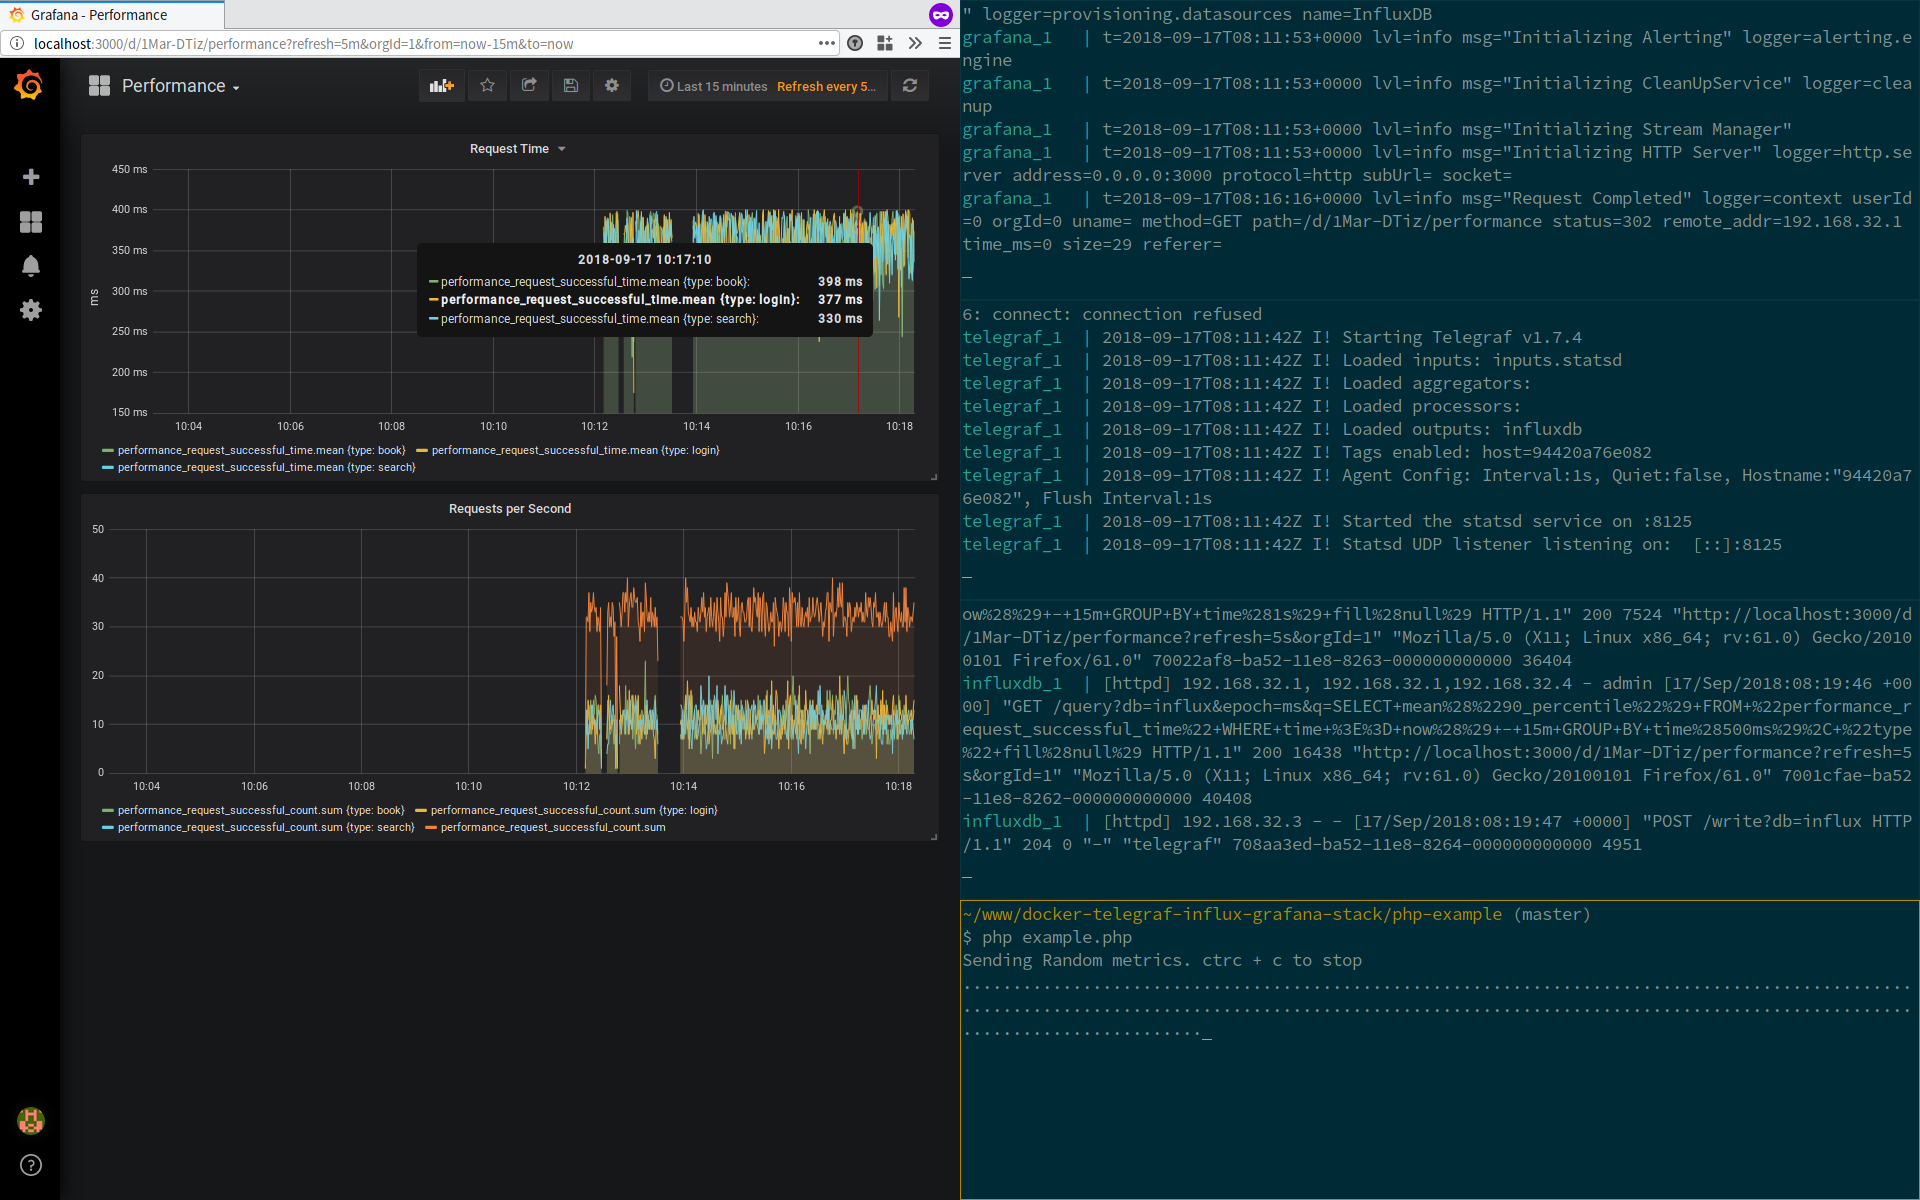
Run the PHP Example
The PHP example generates random example metrics. The random metrics are beeing sent via UDP to the telegraf agent using the StatsD protocol.
The telegraf agents aggregates the incoming data and perodically persists the data into the InfluxDB database.
Grafana connects to the InfluxDB database and is able to visualize the incoming data.
$ cd php-example $ composer install $ php example.php Sending Random metrics. Use Ctrl+C to stop. ..........................^C Runtime: 0.88382697105408 Seconds Ops: 27 Ops/s: 30.548965899738 Killed by Ctrl+C
License
The MIT License (MIT). Please see License File for more information.
版权声明:
1、该文章(资料)来源于互联网公开信息,我方只是对该内容做点评,所分享的下载地址为原作者公开地址。2、网站不提供资料下载,如需下载请到原作者页面进行下载。
3、本站所有内容均由合作方或网友上传,本站不对文档的完整性、权威性及其观点立场正确性做任何保证或承诺!文档内容仅供研究参考学习用!
4、如文档内容存在违规,或者侵犯商业秘密、侵犯著作权等,请点击“违规举报”。
